

To come out profitable in the cryptocurrency market, you must do your own research. It may take some time, but starting your journey by learning as much as possible about crypto investments goes a long way. Then, once you have grasped the basics, you will want to explore topics like tokenomics to identify the many elements that affect a token’s utility and value. At this stage in your trading career, fundamental and technical analyses come into play. You may have heard of these terms before. However, you may need to learn what they mean if you are new to crypto (or investing in general).
If you are familiar with these concepts, you might wonder how fundamental and technical analysis differ. Which is better for crypto investing? Can fundamental and technical analysis be used together while investing in cryptocurrencies?
While they all serve the common goal of helping make an investment decision, both strategies differ significantly. This article will introduce you to fundamental and technical analyses in crypto, including their strengths and downsides, and how to use them effectively.
Why do we analyze cryptocurrencies?
The cryptocurrency market is highly volatile at times. The lack of a central authority or governing body makes price movements unpredictable, and with several factors affecting the direction in which the overall market may move, traders must make the right decisions to remain profitable or, in most cases, avoid huge losses.
To avoid making wrong decisions, traders use fundamental and technical analyses to gauge the overall market, or a particular crypto asset, before investing their hard-earned money in the emerging crypto sector.
In other words, analyzing cryptocurrencies is like packing your bags before venturing out on a journey. While it is impossible to predict the weather conditions, the least we can do is look at the clouds and evaluate whether it might rain, and as such, stay prepared.
What is fundamental analysis?
Analyzing an asset’s short- and long-term values is the foundation of any successful investment or trade. Fundamental analysis is an evaluation process that considers related economic and financial factors when evaluating an asset. In the traditional market, fundamental analysts examine information such as a company’s balance sheets, industry-wide economic developments likely to have an impact, and even the institution’s inner workings, to determine the company’s intrinsic value.
This kind of research is typically favored by those investing for the long haul. By analyzing all of the publicly accessible information about a firm or investment, fundamental analysis determines the intrinsic value of the asset. The goal is to determine whether the asset is undervalued or overvalued as accurately as possible.
However, cryptocurrency projects cannot be assessed in the same way as traditional companies. Bitcoin (BTC) and other decentralized cryptocurrencies are more comparable to commodities rather than equities. Even in the case of more centralized cryptocurrencies (such as those developed by private companies), standard FA indicators can only give us limited information.
To determine a token’s intrinsic value, traders examine the market from a broad perspective and gradually distill it down to the most critical metrics. The most popular metrics fundamental analysts use are project, fiscal, and on-chain metrics.
Let’s examine each of these individually to understand why they are better.
Project metrics
Things like the whitepapers and tokenomics are included in the project metrics.
A whitepaper’s standard components include an introduction, descriptions of the problems the project is trying to solve, product and solution specifications, token and tokenization details (e.g., how many, why), funding, and details of the team. On the other hand, tokenomics comprehensively analyzes the token’s consensus mechanism, distribution, and utility.
Using these, analysts can gauge the overall quality of the project. For instance, a project with a vaguely defined use case is not an ideal investment. Similarly, a project with poorly explained tokenomics should also raise a red flag.
Finally, the project team plays a significant role in establishing trust in the community. Generally, it is considered wise to put your money into coins whose development teams have the appropriate academic and professional experiences.
Fiscal metrics
The two primary fiscal metrics for cryptocurrency are liquidity and market capitalization. In addition to reflecting market sentiment and wider public confidence in a digital asset, liquidity quantifies how quickly and readily an asset can be exchanged for fiat currency. On the other hand, market cap equals the total number of coins in circulation multiplied by the price. These metrics help analysts assess the popularity of a project.
On-chain metrics
On-chain metrics for a cryptocurrency include data such as active address status, transaction value, transaction count, and transaction fee.
The transaction value is the total value of all transactions executed within a specific time period. Meanwhile, the transaction count measures the number of trading activities linked with a cryptocurrency. The higher the transaction count, the greater the likelihood of growth for that particular coin.
Finally, the transaction fee reveals the demand for a coin. Higher fees indicate that investors are prepared to pay more to miners or validators to speed up the confirmation of their transactions.
What is technical analysis?
Technical analysis is a trading strategy that analyzes the value of an investment based on data and patterns of that asset’s present and historical price movements and trading volume. The idea is that an asset’s historical price movements and market activity may be utilized as reliable indicators of where that asset’s price is likely headed in the future.
In contrast to a fundamental analyst, who considers a company’s ability to grow its profit base and the quality of its assets, the technical analyst looks exclusively at the asset’s past price movements and trading volume.
Technical analysts assess the market by analyzing charts, graphs, and mathematical formulas to identify recurrent patterns that can signal a buy or sell response. Since the nature of the underlying asset is ignored, technical analysts will evaluate these signals relative to other technical indicators to check if they offer a similar narrative.
Simply said, while fundamental analysis urges investors to gauge a project’s intrinsic value, technical analysis is focused on methodologies for anticipating asset price action.
Although there are numerous tools used in technical analysis, they may be roughly sorted into four groups: trend indicators, volume indicators, magnitude indicators, and chart analysis.
Trend Indicators
These indicators, as the name implies, help evaluate the direction of the market trend. They examine the prevailing market trend and identify whether it is in a sideways phase or an entrenched bullish or bearish trend. Among the many popular trend indicators are the moving average convergence/divergence (MACD) and the relative strength index (RSI), as well as Bollinger Bands and moving averages (MA).
Momentum indicators
Momentum indicators indicate whether a cryptocurrency asset is overbought or oversold compared to the overall market sentiment. Popular momentum indicators include the Rate of Change and the Moving Average Convergence/Divergence (note that MACD is a trend-following momentum indicator).
Volume indicators
Trading volume is a leading indicator of market sentiment in the cryptocurrency market. The term “volume” is commonly used to describe the degree of market activity. Volume analysis rests on the premise that volume precedes pricing.
In an uptrend, volume increases as prices rise and decreases as prices fall. Conversely, in a downtrend, the volume should increase as prices fall and shrink as prices rise. The Money Flow Index (MFI) and On-Balance-Volume (OBV) are two widely used volume indicators (OBV).
Chart analysis
Analyzing charts involves looking at patterns over different time frames (hourly, monthly, yearly) using tools like chart patterns. Analysts can identify potential support and resistance zones by employing multiple charting tools. This helps make informed investing decisions.
Pros of fundamental analysis
- More suited for long-term investors: Fundamental analysts draw conclusions from what they think will happen in the future and not from price charts that show what happened in the past. Because of this, fundamental analysis is better for making long-term investment decisions.
- Easier to learn and understand: Fundamental analysis is easier to understand and learn than technical analysis because it does not require specific skills like reading and comprehending charts and trend lines.
- Presents a complete overview of an asset: By putting together all the available information about a project, fundamental analysis gives investors a complete overview of an asset.
- Easy sourcing of information: Readily available databases like Coinmarketcap, Glassnode, and others contain lots of offline and on-chain data regarding most cryptocurrency projects. This makes sourcing information fairly easy.
Pros of technical analysis
- Requires less research: Once learned, technical analysis is easier to compute than fundamental analysis. It looks at fewer metrics, like the price and volume of crypto assets.
- Not dependent on users’ perception or understanding of market: While fundamental analysis often depends on an investor’s intuition, technical signals are developed based on prior price data, giving investors a guideline of what to expect when a signal is triggered.
- Helps identify the change in trends: Technical analysis is mainly about identifying new trends and reversals. This makes it easier to understand when to enter and leave a trade.
Cons of fundamental analysis
- Tools for technical analysis can give mixed signals: Results from technical analysis are sometimes confusing, making trading decisions hard to implement.
- It requires expertise: It is easy to gather data in technical analysis, but it takes practice to understand how to interpret charts and patterns.
- Extreme volatility leaves room for error: Most digital currencies are known for being very volatile, which can also affect the outcomes of any indicator used.
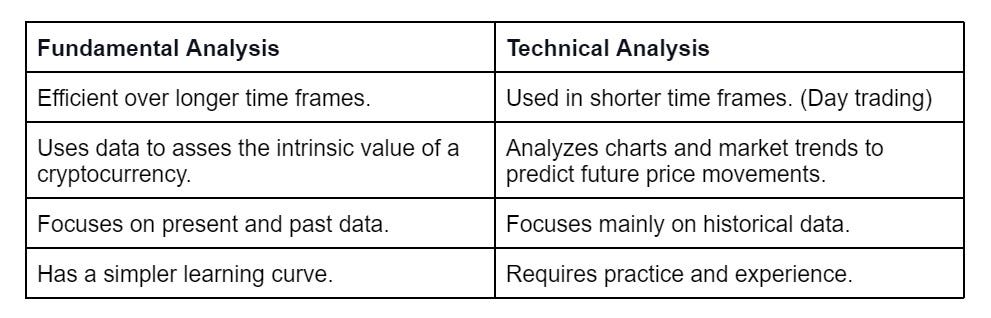
Difference between fundamental analysis and technical analysis
Which analysis is best for crypto trading?
The choice between fundamental and technical analyses should be based on a trader’s personality and goals. Fundamental analysis suits long-term investors and traders, whereas technical analysis suits short-term traders. However, keep in mind that fundamental and technical analysis can work together. For example, long-term traders can also use technical indicators to make informed trading decisions.
Conclusion
Strategies for trading cryptocurrencies can be based on fundamental analysis, technical analysis, or both. Always remember that the most successful crypto traders will have a firm grasp of both fundamental and technical analyses. Otherwise, you are just flying blind through the dynamic cryptocurrency market. In other words, investing without proper knowledge makes it as risky as gambling.
Important Disclosures:
Certain statements in this document might be forward-looking statements, including those identified by the expressions “anticipate”, “believe”, “plan”, “estimate”, “expect”, “intend”, “target”, “seek”, “will” and similar expressions to the extent they relate to the material produced by Bytex staff member. Forward-looking statements are not historical facts but reflect the current expectations regarding future results or events. Such forward-looking statements reflect current beliefs and are based on information currently available to them. Forward-looking statements are made with assumptions and involve significant risks and uncertainties. Although the forward-looking statements contained in this document are based upon assumptions the author of the material believes to be reasonable, none of Bytex’s staff can assure potential participants and investors that actual results will be consistent with these forward-looking statements. As a result, readers are cautioned not to place undue reliance on these statements as a number of factors could cause actual results or events to differ materially from current expectations
The commentaries contained herein are provided as a general source of information based on information available as of MMMM DD, 2022. Every effort has been made to ensure accuracy in these commentaries at the time of publication; however, accuracy cannot be guaranteed. Market conditions may change investment decisions arising from the use or relevance of the information contained here. ByteX. makes no representation or warranty to any participant regarding the legality of any investment, the income or tax consequences, or the suitability of an investment for such investor. Prospective participants must not rely on this document as part of any assessment of any potential participation in buying and selling of virtual currency assets and should not treat the contents of this document as advice relating to legal, taxation, financial, or investment matters. Participants are strongly advised to make their own inquiries and consult their own professional advisers as to the legal, tax, accounting, and related matters concerning the acquisition, holding, or disposal of a virtual currency. All content is original and has been researched and produced by ByteX.